Harvard ManageMentor — Designing a Global Leadership Development Platform
Designing the UX, learning activities, assessments, reporting, and infographics for a platform built on decades of business content — and flexible enough to serve thousands of organizations worldwide.
This is an older project from early in my career at HBP. The tools have evolved significantly — I work exclusively in Figma today — but the UX principles I learned here (understanding learner needs, simplifying complex interactions, designing for diverse global audiences) are ones I've built on in every project since.
Context
Harvard ManageMentor is HBP's flagship leadership and management development platform — 200+ modules built on decades of business content, used by organizations worldwide to develop their people. When a new version of the platform was being built, the previous iteration had lived on a home-grown system. The team knew a lot going in: what companies valued, where learners struggled, what progress signaling they needed, and the requirement that the platform remain flexible enough to support vastly different completion criteria across thousands of client organizations.
I joined as the designer responsible for all infographics and handouts. Over time I was brought in to help design the learning courses themselves — the activities within them, the assessments, the reporting experience, and all image selection across topics and subtopics. The design direction was shaped by what we’d learned from the previous platform and the pedagogical goals set in close collaboration with the Editorial team.
Scope of Work
Learning experience design
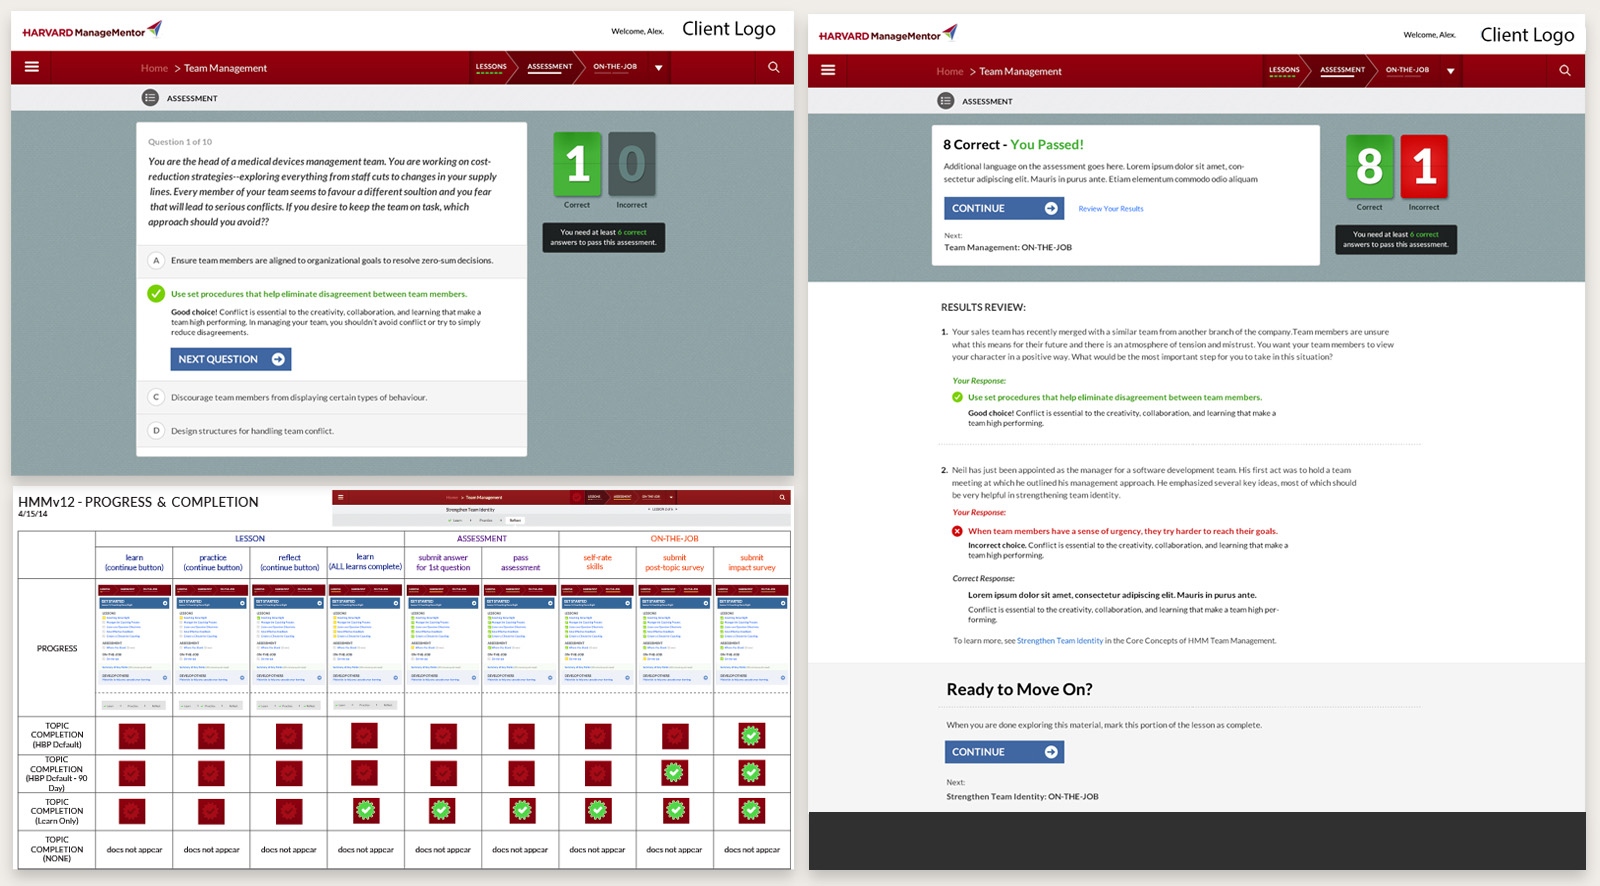
Working alongside Editorial as they developed each topic, we defined the types of activities that would appear within courses and the pedagogical goals each one served. The activity types included scenarios, quizzes, flashcard components, on-the-job activities, and full course assessments. For each, I designed the interaction patterns — how learners moved through them, received feedback, and understood their progress.
Assessments
I designed the full assessment flow: how learners took assessments, how scores were presented, how retakes were handled, and what feedback they received at each stage. Getting this right mattered not just for learners but for the organizations using the data — completion and assessment results fed directly into reporting.
Reporting
The reporting experience was one of the more complex design challenges on the platform. It needed to surface Learning Impact scores, user engagement and activity, progress tracking, and course and topic popularity — all in a way that was meaningful for HR administrators and managers with very different needs. I designed the reporting views to make this data navigable and actionable for the range of people using it.
Image direction
I selected imagery across all topics and subtopics on the platform — a significant curation effort given the breadth of content. The goal was visual consistency and relevance across a wide range of business and leadership subject matter, for a global audience.
Infographics & Handouts
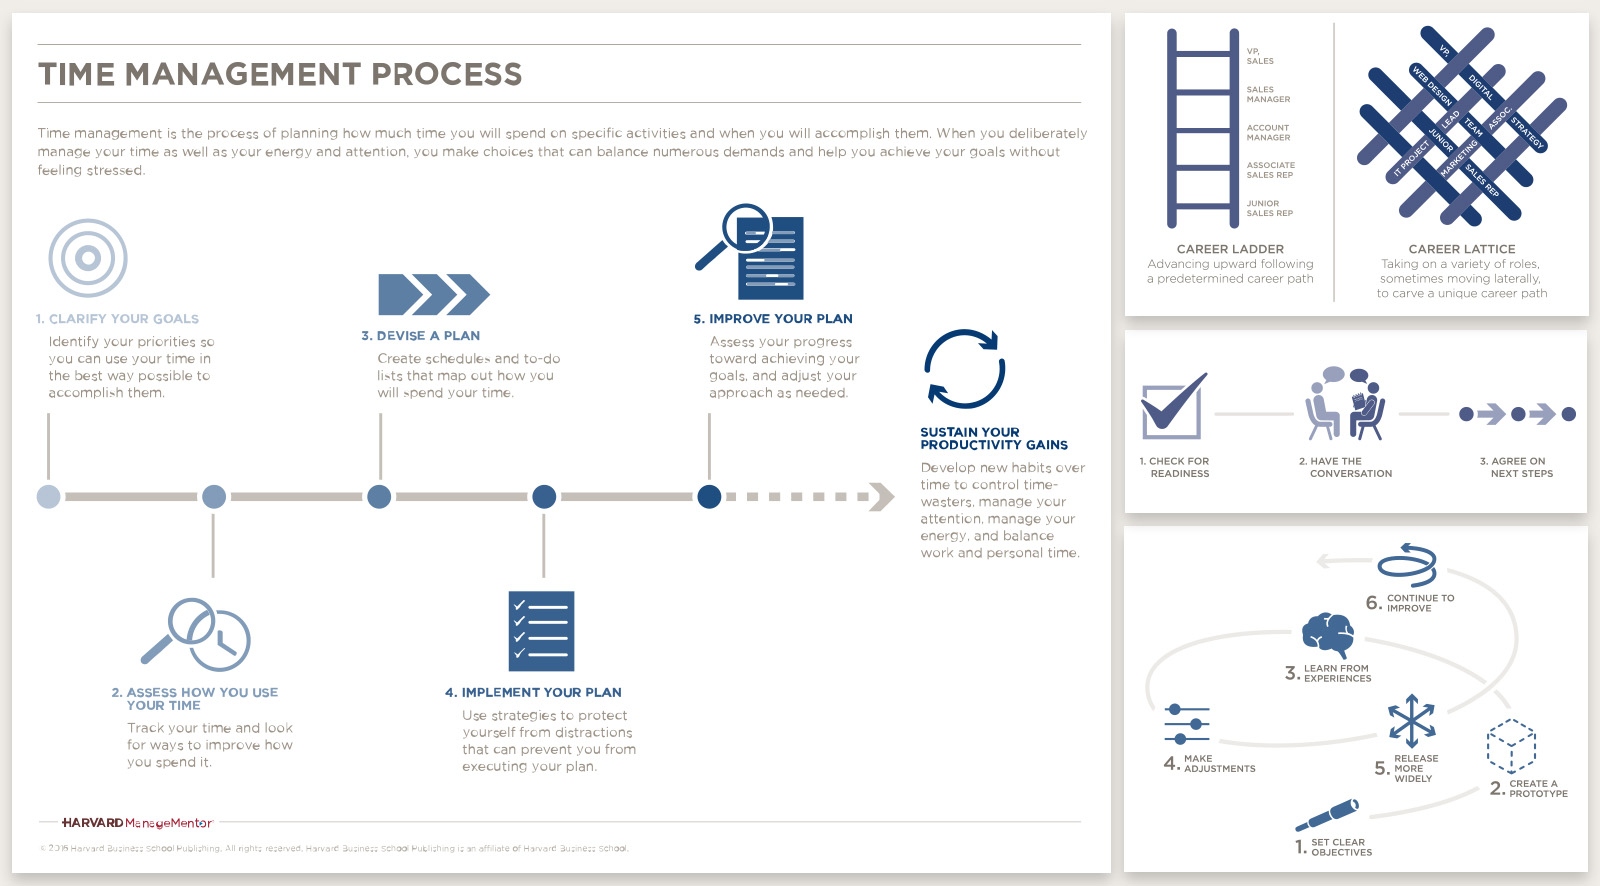
In addition to the course UX, I owned the infographic and handout program. Infographics were embedded in courses on the web to reinforce key learnings; handouts were downloadable PDFs for learners to keep. I managed the outside vendor who produced the infographics — giving design feedback, working with Editorial to ensure accuracy, and handling all exporting and formatting for both web and print delivery.
Outcomes
- Designed learning activities, assessments, and reporting for 200+ modules across a global platform
- Collaborated with Editorial on activity types and pedagogical goals for each topic
- Designed the full assessment flow including scoring, retakes, and feedback
- Designed reporting views for Learning Impact scores, engagement, progress, and popularity
- Managed infographic vendor: feedback, accuracy review, and web/print export
- Selected imagery across all topics and subtopics for a global learner audience
- Continued contributing as new topics were added over the following three years